Check out my new piece on ReadWriteWeb about the latest goings on at Digg. Link here…
![]()
New research out from Forrester, called Social Technographics (whatever that means) – Slides here – that talks about who uses social media etc. I wouldn’t read too much into the numbers as its just one data point but its good for a 20 thousand feet level analysis.
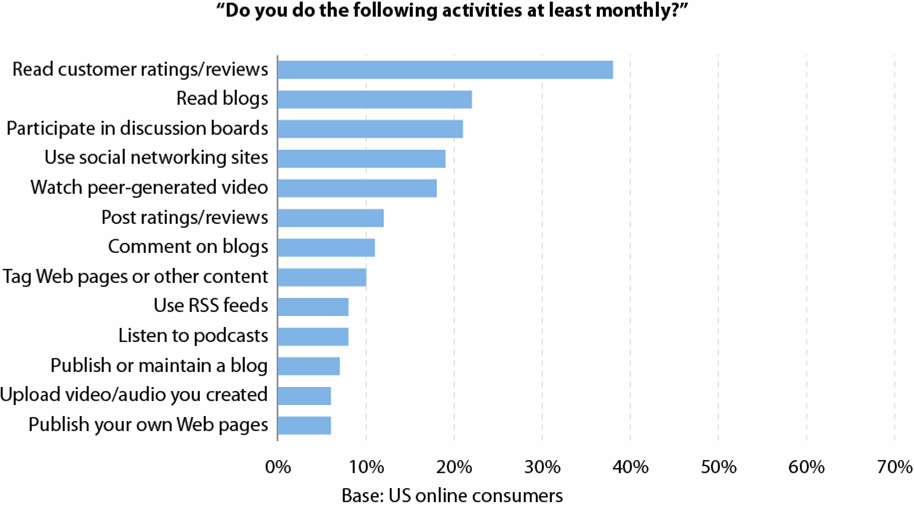
(All images via Forrester)
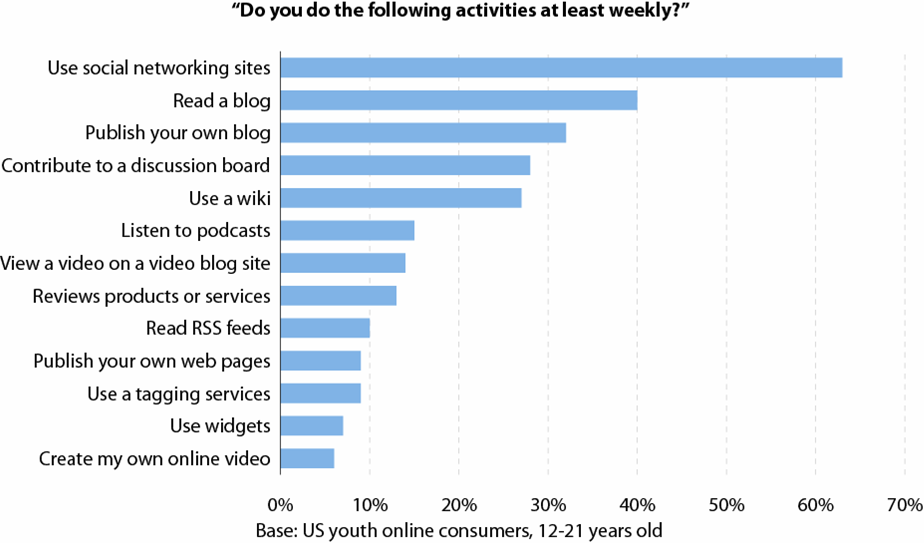
This is interesting although a bit lower then I would have thought. Its clear though that the youth is leading the charge.
Another interesting breakdown below about further segmentation of participation. The breakdown below does not square with the 90-9-1 rule as its looking at the data related to participation at least once/per month, rather than aggregate number of visits.
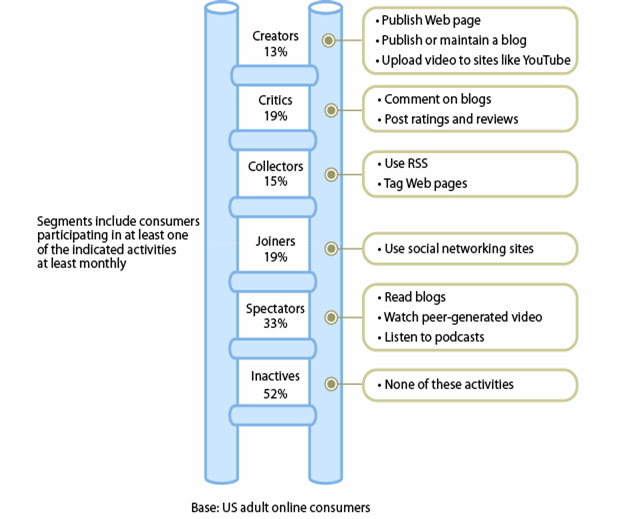
Some interesting data here…nothing earth shattering though (slides have some additional details on each of the type of users)…somewhat surprisingly critics show up as the highest earners…In a way it makes sense as critics are too busy to be full-time creators but articulate enough to be good critics.
What do you think?
An interesting post from Bruce Nussbaum at his blog on BusinessWeek. I am summarzing the main data points below (the data is based on a study by Bill Tancer, an analyst with Hitwise, which measures Web 2.0 audiences):

From Bruce’s blog:
So, the question is–who is shaping the conversation? These numbers suggest that only a very, very small number of people actively create content in social media. Nearly everyone watches.
So are we really just reinventing TV, with folks pretty much sitting back passively (like couch potatoes)? Is YouTube just another NBC or Fox TV network?
Could be. These YouTube and Flickr numbers are even worse than the 1% Rule–for every 100 users of social media, only ten actively participate, and only 1 actually creates something. Back in July, 2006, the ratio of creators to consumers on YouTube was 0.5%. Now it is 0.16%. Many more people are drawn to YouTube to watch than to create.
To be honest, the biggest surprise for me in these numbers is the Wikipedia number…4.6% users edit…Wow!!!. I am not sure its fair to use these numbers to discount the 90-9-1 rule of participation in social media. I think some of the specific participation numbers are skewed because of the type of media we are talking about(I think 90-9-1 rule writers had text content in mind)…Video is a lot harder to produce then to watch…same thing for pictures but probably to a lesser extent.
At the end of the day, the lack of participation reflects the lack of incentives to participate. While the ego benefits of creating a popular video are huge, the changes of doing so are fairly minimal and the skills/time required are pretty significant. For the text based context, like comments, social bookmarks or bulletin boards, its hard to prove ones identity and because of that its really hard to establish the benefits of participation. The result…90-9-1 rule.
What do you think?
Fascinating piece from Nick Carr where he refers to a study by Dirk Riehle, a researcher with SAP, on the subject on open source software. Besides the obvious conflict of interest, the piece raises some interesting questions.

A new article in IEEE Computer, “The Economic Motivation of Open Source Software: Stakeholder Perspectives,” sheds some interesting new light on an old question: Is open source software development good or bad for programmers?
The author of the IEEE Computer article, Dirk Riehle, a researcher with SAP, doesn’t look at that question directly. Rather, he examines, in a theoretical way, how open source changes the economics of the IT markets in which programmers participate. He first looks at why big systems integrators and other “solutions” providers, like IBM, have been promoting open source. He argues that these companies, which sell bundles of products and services to their clients, like open source because it allows them to reduce the amount of money they have to pay to software vendors without requiring that they pass along the savings to customers in the form of lower prices. In other words, the software savings turn into additional services profits, which fall to the solutions providers’ bottom lines. Ultimately, that means that open-source software developers are subsidizing the big solution providers at their own expense. Writes Riehle: “If it were up to the system integrators, all software would be free (unless they had a major stake in a particular component). Then, all software license revenue would become services revenue.” (I would think it’s an overstatement to say that all software license revenue turns into services revenue; assuming there’s competition between solutions providers, some of the savings would go to the customers.)
Riehle also looks at the economic effect of open source on software markets themselves. He argues that, by tearing down the barriers to entry in software markets (by obviating the huge up-front investments required to create a proprietary program), open source spurs competition, which in turn reduces prices and erodes the profits of software vendors. Riehle writes: “Customers love this situation because prices are substantially lower than in the closed source situation. System integrators love the situation even more because they can squeeze out proprietary closed source software.” For the programmers themselves, however, much of the savings reaped by customers and added profits taken in by integrators comes out of their own pockets.
Riehle also notes that open source (because of its openness) tends to diffuse knowledge of particular programs among a much broader set of programmers. That will tend to increase competition among the programmers and hence depress their pay: “Technical skills around the open source product are a key part of determining an employee’s value to a [vendor]. Anyone who’s smart enough can develop these skills because the open source software is available to people outside the firm. Hiring and firing becomes easier because there’s a larger labor pool to draw from, and switching costs between employees are lower compared with the closed source situation. Given the natural imbalance between employers and employees, this aspect of open source is likely to increase competition for jobs and drive down salaries.”
Its a very odd conclusion to an interesting analysis…I would have though that as open source software become popular, engineers who work on open source, can develop and sell their skills to a larger market…this makes their skill set more valuable over a longer period of time. Also the fact that open source reduces cost of the software means that more and more people will be willing to pay for people with skills with open source software…In my experience that is indeed what is happening.
Even the large enterprises seemed to have learned a lesson from the excesses of the boom times and seem reluctant to sign huge deals for proprietary software and then pay through the nose for services. In such situation the economic rent is accruing more widely and evenly to the open source engineers.
What do you think?
I was at the Web 2.0 expo yesterday…I published the following post at the RWW from there…Its a bit geeky but check it out here.
Interesting study from Comscore about the behavior of users with regards to managing cookies on their computers. The data is presented in a somewhat convoluted manner, so let me highlight the key points:

Overall, this data sounds about right as it jives well with data I got from a buddy of mine at Yahoo!. Some of the business implications of the data above are:
What do you think?
Fascinating article in the NYT today (I am again quoting NYT…It seems they have really gotten their act together of late in the high-tech/network world space). The article talks about the theory of “Cumulative Advantage” or the “rich get richer” effect. In summary the theory suggests that our preferences/decisions are very much effected by what other people are doing. So if a technology or a singer or a movie is liked by our peers we are more likely to try it and like it. We provided another example of this phenomenon (without naming the theory) in a prior post related to behavior of users at Digg where we observed that a fake article got a number of Diggs just because a user paid of a few Diggs to get initial momentum.

Conventional marketing wisdom holds that predicting success in cultural markets is mostly a matter of anticipating the preferences of the millions of individual people who participate in them. From this common-sense observation, it follows that if the experts could only figure out what it was about, say, the music, songwriting and packaging of Norah Jones that appealed to so many fans, they ought to be able to replicate it at will. And indeed that’s pretty much what they try to do. That they fail so frequently implies either that they aren’t studying their own successes carefully enough or that they are not paying sufficiently close attention to the changing preferences of their audience.
The common-sense view, however, makes a big assumption: that when people make decisions about what they like, they do so independently of one another. But people almost never make decisions independently — in part because the world abounds with so many choices that we have little hope of ever finding what we want on our own; in part because we are never really sure what we want anyway; and in part because what we often want is not so much to experience the “best” of everything as it is to experience the same things as other people and thereby also experience the benefits of sharing.
The authors set out to test out the theory with an interesting experiment:
Because it’s not possible in the real world to test theories about events that never happened, most of what we know about cumulative advantage has been worked out using mathematical models and computer simulations — an approach that is often criticized for glossing over the richness of real human behavior. Fortunately, the explosive growth of the Internet has made it possible to study human activity in a controlled manner for thousands or even millions of people at the same time. Recently, my collaborators, Matthew Salganik and Peter Dodds, and I conducted just such a Web-based experiment. In our study, published last year in Science, more than 14,000 participants registered at our Web site, Music Lab (www.musiclab.columbia.edu), and were asked to listen to, rate and, if they chose, download songs by bands they had never heard of. Some of the participants saw only the names of the songs and bands, while others also saw how many times the songs had been downloaded by previous participants. This second group — in what we called the “social influence” condition — was further split into eight parallel “worlds” such that participants could see the prior downloads of people only in their own world. We didn’t manipulate any of these rankings — all the artists in all the worlds started out identically, with zero downloads — but because the different worlds were kept separate, they subsequently evolved independently of one another.
This setup let us test the possibility of prediction in two very direct ways. First, if people know what they like regardless of what they think other people like, the most successful songs should draw about the same amount of the total market share in both the independent and social-influence conditions — that is, hits shouldn’t be any bigger just because the people downloading them know what other people downloaded. And second, the very same songs — the “best” ones — should become hits in all social-influence worlds.
What we found, however, was exactly the opposite. In all the social-influence worlds, the most popular songs were much more popular (and the least popular songs were less popular) than in the independent condition. At the same time, however, the particular songs that became hits were different in different worlds, just as cumulative-advantage theory would predict. Introducing social influence into human decision making, in other words, didn’t just make the hits bigger; it also made them more unpredictable.
Where does this leave us with the rational choice and perfect market theory? Do you think people are more rational when it comes to money? What about making investments? How should VCs or any investor for that matter, evaluate a new consumer technology or a mass market product? This is powerful stuff.
The new state of the blogosphere report (its called Live Web now – interesting repositioning by Technorati) is out now…Some of the interesting takeaways from the report are:
1. The total number of blogs is increasing (we already were counting 80M). Technorati is now tracking 70M blogs. Below is how the growth curve looks and it is following kinda of the same pattern we expected.
2. While the growth rate is slowing down (law of large numbers) the influence of the blogosphere/citizen media/Live Web is increasing in a big way (22 blogs in top 100 media influencers compared to 9 last time)
3. Tagging of content is on the rise…It looks like tagsonomy is here to stay.
4. Blogosphere is becoming more global.
Net Net…Blogosphere is maturing. More people know about blogs so the kind of blog accounts where users were experimenting with starting a blog and then abandoning is slowing down and so the size is growing but more reasonably.
Update (more data from web 2.o via RWW)
David Sifry notes that influential bloggers post more frequently, on average twice a day. Whereas “magic middle” bloggers (about 3M) post on average once a day. Also influential bloggers have been at this at least 1-2 years. Finally, 88% of the top 100 is different than one year ago – i.e. it’s very fluid.
Great article in BusinessWeek how Internet and Social media (despite the occasional nastiness) is making business become more accountable:

Home Depot’s (HD ) CEO goes into an emergency huddle with his crisis management team after 14,000 bilious customers storm an MSN (MSFT ) comment room.
The venom of crowds isn’t new. Ancient Rome was smothered in graffiti. But today the mad scrawls of everyday punters can coalesce into a sprawling, menacing mob, with its own international distribution system, zero barriers to entry, and the ability to ransack brands and reputations. No question, legitimate criticism about companies should get out. The wrinkle now is how often the threats, increasingly posted anonymously, turn savage. Even some A-list bloggers are wondering if the cranks are too often prevailing over cooler heads.
Most companies are wholly unprepared to deal with the new nastiness that’s erupting online. That’s worrisome as the Web moves closer to being the prime advertising medium—and reputational conduit—of our time. “The CEOs of the largest 50 companies in the world are practically hiding under their desks in terror about Internet rumors,” says top crisis manager Eric Dezenhall, author of the upcoming book Damage Control. “Millions of dollars in labor are being spent discussing whether or not you should respond on the Web.”
In the beginning, the idea of this new conversation seemed so benign. Radical transparency: the new public-relations nirvana! Companies, employees, and customers engage in a Webified dialectic. Executives gain insight into product development, consumer needs, and strategic opportunities. All the back-and-forth empowers consumers, who previously were relegated to shouting at call-center minions. Venom can be a great leading indicator.
Trashing brands online can also be high theater. Rats cruising around a Greenwich Village KFC/Taco Bell (YUM ) on YouTube (GOOG ). MySpacers (NWS ) busting their employers’ chops. Faux ads bashing the Chevy (GM ) Tahoe as a gas-guzzling, global-warming monster. Millions of people watch this stuff—then join in and pile on. Is it any wonder companies lose control of the conversation?
When the Web turns against them, executives are faced with the problem of how to manage the blowback. They have two choices: ignore the smaller furies and hope they won’t metastasize, or respond outright to the attacks. It’s rarely a good idea to lob bombs at the fire-starters. Preemption, engagement, and diplomacy are saner tools.
…But what happens when the uproar grows so noisy that the mainstream media is bound to pick it up? That’s exactly the position new Home Depot CEO Francis S. Blake found himself in last month. MSN Money columnist Scott Burns accused Home Depot of being a “consistent abuser” of customers’ time. Within hours, servers were caving under the weight of 10,000 angry e-mails and 4,000 posts, which took the company to task for pretty much everything. It was the biggest response in MSN Money’s history. Blake’s predecessor, Robert L. Nardelli, the guy who famously didn’t allow comments at the company’s annual meeting, simply would have ignored the mob. But Blake knew the controversy could quickly mushroom.
The only way over it, he decided, was through it. So Blake penned a heartfelt and repentant online letter to all Home Depot customers, essentially copping to the company’s less-than-stellar service. He promised to increase staffing and begged for the chance to make good. He created a site to deal specifically with service. He thanked Scott Burns.
In crisis-management circles, the gamble was viewed as a win. Blake actually generated rare applause on an unofficial Home Depot employee site called the Orange Blood Bank, where workers are more likely to post riffs knocking the company. (“You can’t do it, and we’ll never help.”)
I think this is a good thing for all parties, if you take longer view of things…This makes people more accountable and that is always a good thing.
You are all probably familiar with my previous posts (New audience metric, AttentionTrust) about the need for better metric to measure the engagement level of users at a particular web-site. The issue with the current metric of page-views can be best understood by comparing it with TV surfing. Consider a user Ms. X, with a remote, who surfs to a particular channel say FOX and immediately switches over to NBC where she watches a full hour of Apprentice. With page-views, which only measures the number of times a particular page loads or channel is accessed in our example, both NBC and FOX will get equal equal credit for the user. Clearly though, NBC had a better opportunity to engage the user and will likely be a more effective advertising medium for somebody looking to reach the Ms. X.
This inequality in the way the page views are measured is further exacerbated by the difference in which web sites can vary in information density per page. The use of technology like AJAX can enable web-sites to pack a whole lot of dynamic information in just one page. Check out the Noisely…I love this web-site design and the whole application is just one page (except for informational pages like FAQ etc.). All this means that we need a better way to measure the user engagement in order to better evaluate the effectiveness of web-sites.

Last week Compete.com, a web measurement company, announced the first metric to measure of this important data. From the compete.com blog:
Today we announce that you can use Compete.com to measure a site’s Attention. Attention fuses engagement (measured by time) and traffic (measured by unique visitors) into a single, more complete picture of a web site’s value.
…
Why is Attention Important?
- A site’s influence can be under/over stated by traditional metrics.
- There are only 24 hours in a day – our time is finite. Where we spend our time is where we find the most value.
Notice in the chart above how runescape.com only ranks 436th in unique visitors, yet based on Attention is the 15th most prominent site on the web. If we relied solely on traditional metrics we would overlook the real value and prominence of Runescape.
This is fantastic…I hope more companies follow suite and we can finally focus on truly important metric rather then the arbitrary page views.
If you want to follow this story further check out RWW coverage.


