New research out from Forrester, called Social Technographics (whatever that means) – Slides here – that talks about who uses social media etc. I wouldn’t read too much into the numbers as its just one data point but its good for a 20 thousand feet level analysis.
(All images via Forrester)
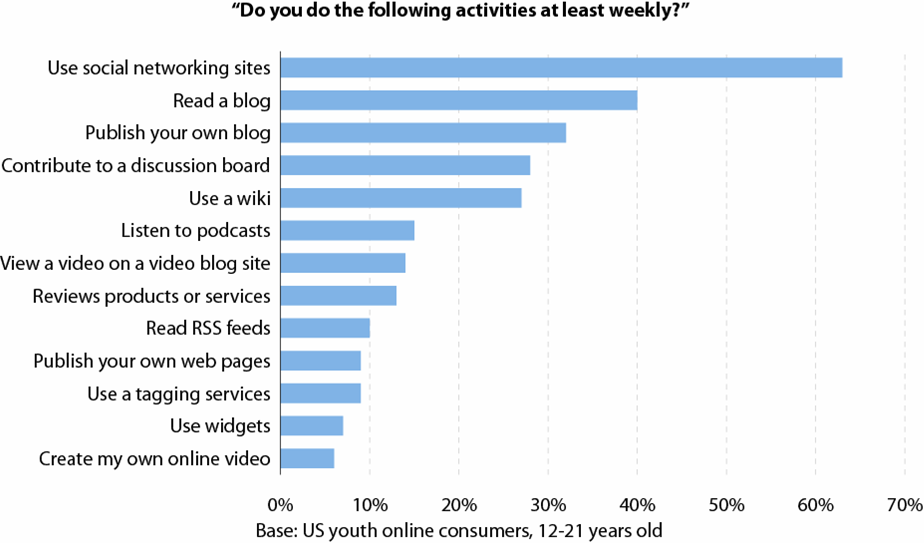
This is interesting although a bit lower then I would have thought. Its clear though that the youth is leading the charge.
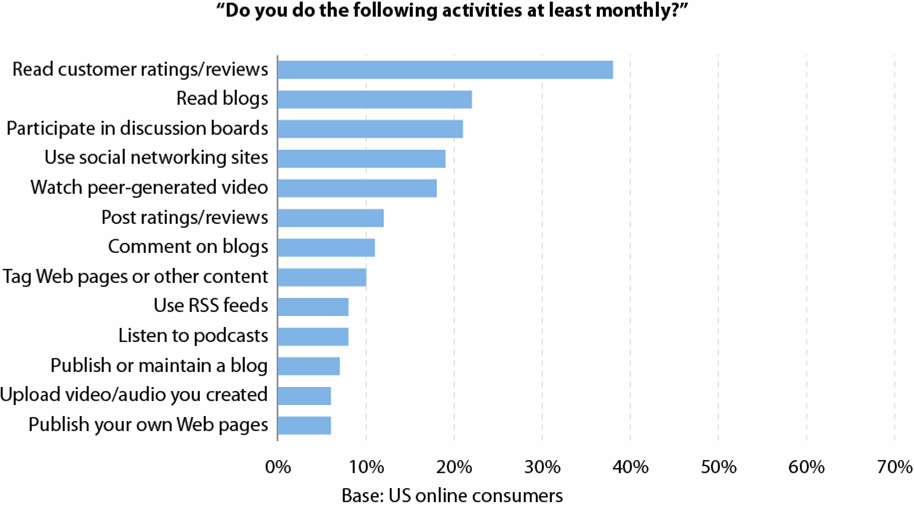
Another interesting breakdown below about further segmentation of participation. The breakdown below does not square with the 90-9-1 rule as its looking at the data related to participation at least once/per month, rather than aggregate number of visits.
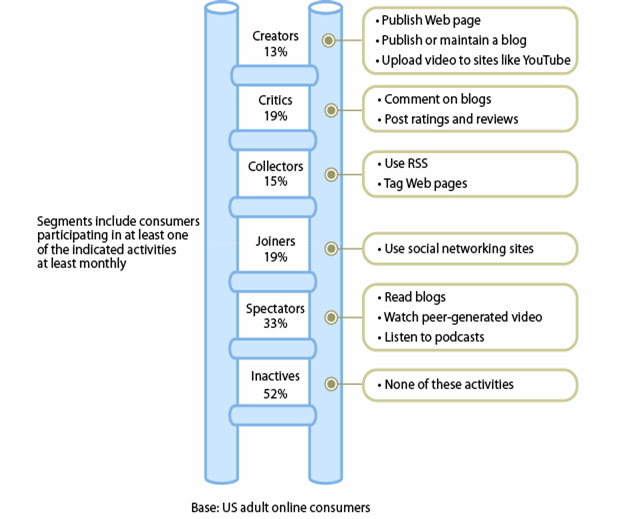
Some interesting data here…nothing earth shattering though (slides have some additional details on each of the type of users)…somewhat surprisingly critics show up as the highest earners…In a way it makes sense as critics are too busy to be full-time creators but articulate enough to be good critics.
What do you think?
